Fibonacci Spirals
## No renderer backend detected. gganimate will default to writing frames to separate files
## Consider installing:
## - the `gifski` package for gif output
## - the `av` package for video output
## and restarting the R session
The image below shows the arrangement of seeds in the middle of a sunflower. The seeds are arranged in a pattern - generally knows as phyllotaxis. In nature, many plants show this arrangement of leaves and seeds.
This post helped in understanding the mathematics behind the arrangement. Three things noted in the arrangement are:
The seeds spiral outward, with each seed positioned at a fixed angle relative to its predecessor.
The fixed angle is given by \(\Gamma = 2\pi(1-\phi)\), where \(\phi = 1.61803...\) is the golden ratio.
The ith seed is placed at a radial distance of \(\sqrt(i)\)
Hence, in the polar coordinates, we can specify \([r,\theta] = [\sqrt(i), \Gamma*i]\). Since I wanted to plot the points on cartersian coordinates, I used the polar to Cartesian conversion factors:
\(x = rCos(\theta)\)
\(y = rSin(\theta)\) and plugged in the values of r and the angle \(\Gamma\) for each location.
x<- c()
y <- c()

goldenratio <- 1.618
gamma <- 2*pi*(1-goldenratio)

for (i in 1:1000){
  x<- c(x,sqrt(i)*cos(i*gamma))
  y<- c(y,sqrt(i)*sin(i*gamma))

}

df <- data.frame(x = x, y = y)

p <- ggplot(data = df, aes(x=x,y=y))+
  geom_point()

p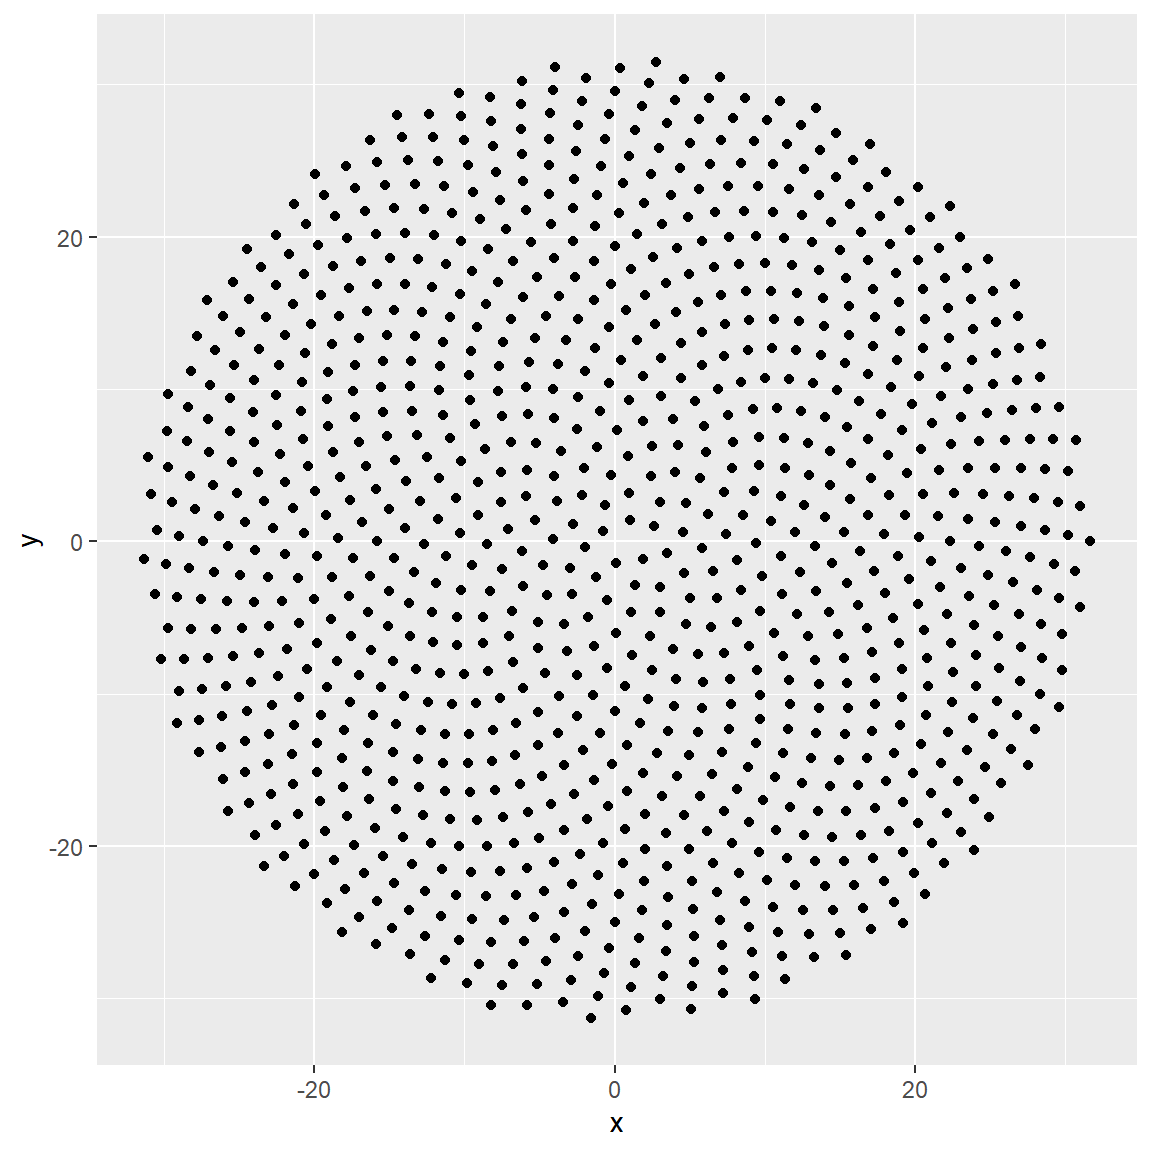
amber.m.ahmed@utexas.edu
Copyright © , Amber Ahmed. All rights reserved.